When Development Outpaces Planning: how the city’s lagging data drives overdevelopment
In summer of 2025, we became concerned about the rapid development in our community, and yet couldn’t find any reports about how much development is happening. So we did something about it- we searched through the Development Services Departments dashboard for any newly issued permits for development since 2021 (the current housing cycle). What we learned is not only that the city lags behind at least a year in tracking permitting, we are exceeding our neighborhoods designated housing capacity three years ahead of the close of the housing cycle in 2029.
Read on for a case study in overdevelopment in Greater Golden Hill. It’s the story of one neighborhood, but can be applied across the City.
Greater Golden Hill: A Case Study in Over-Development
In summer 2025, neighbors noticed rapid development but there was no city report on development density. So we did our own. (Download a PDF file for printing here)
NOTE: We are working with the City Planning Department to confirm our research and interpretation. Stay tuned for updates.
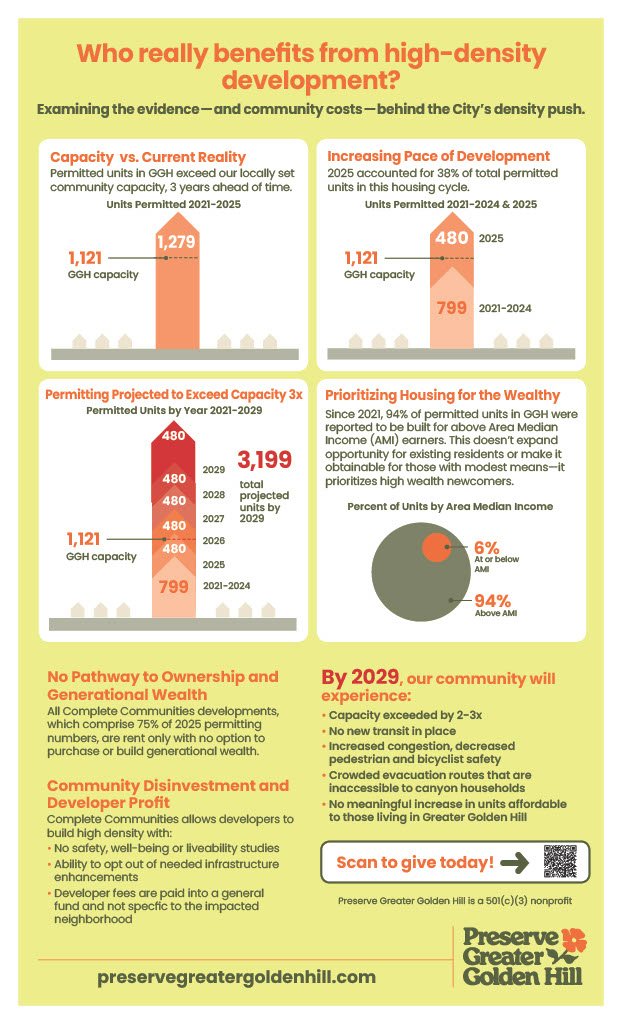
Implications of the City’s Complete Communities Approach
Capacity exceeded by 2-3x
No new transit in place
Increased congestion, decreased pedestrian and bicyclist safety
Crowded evacuation routes, inaccessible to canyon households
no meaningful increase in affordable housing units
no pathway to home ownership and generational wealth
Our mixed income neighborhood will be forever changed- not to the benefit of current residents , but because the city avoided protecting current residents and allowed over-representation of high income earners.
Mapping Density Development
The map below shows all housing units developed in the GGH planning area since 2021. It includes the planning area boundary, three historic districts, and two safe sleeping sites (total of 767 tents) bordering the neighborhood. Click pins to see unit counts; see the map legend for a color key.
Key: Black-project completed; Red-development underway; Yellow-properties that may be next; Purple-safe sleeping sites; Orange Outline-Greater Golden Hill neighborhood boundary; Light Blue Outline-historic neighborhoods